TECHNICAL ANALYSIS – TRENDLINE
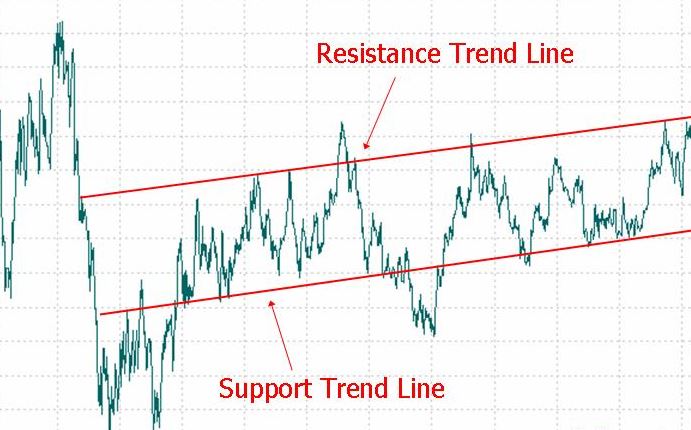
TRENDLINE is a line made by joining picks(high) made in a price chart or by joining bottoms(low) .
RESISTANCE- When price of any scrip can’t go up above a certain level,then it is called resistance.
It happens due to big selling force on a particular price.A scrip has various resistance level for a period of time(time frame).Say silver is @cmp40,200 then R140450, R2-40680, R3-40860
R3 can be said OVERBOUGHT level,where fresh buying may be risky.
SUPPORT-When price of any scrip can’t go down below a certain level,then it is called support.
In above given example of silver S1 may be-40250, S2-40030,S3-39880.
S3 can be said OVERSOLD level,where fresh selling may be risky.
What is fresh buying/selling?
When any commodity falls by 6% and short sellers book their profit,then price may bounce by 1-2%.Price can’t be stable here,It goes down again. This buying is called”SHORTCOVERING”.
If FRESH BUYING is there ,then price becomes stable.It may break previous high.
In the figure given below ,
TRENDLINE’S blue part is working like a support
& red part is like resistance.
In INTRADAY timeframe ,when you see chart of any commodity by ctrl+i
then notice this-
if any strong support breaks at time of data(2.30/8.30pm)
then it will becomes very strong resistance.
STRONG support or resistance means price chart may be touching that line and reversing back
3-4times.
So above trendline- buy on every dip near trend line and keep the stoplosses below trendline.(blue arrows shown in fig)
and
below trendline- sell on every jump near trend line and keep stoplosses above trendline (red arrows shown in fig)
HOMEWORK-
Notice next day on screen, If any commodity is in buying ,It’s average will improve every hour,
means ATP of NG was 222.5,then it became222.9 & 223.4. This confirms strong buying.
In Selling case, ATP goes below every hour.